
Nanostring&ĀäČĒ¸ÛŋÕégļāŊMWŧ°°Š°YŅĐžŋŅĐĶūŅûÕ
ŌČĪŲ§šÜ°ŠĘĮŌģˇNēĐÔŗĖļČŨ^˛îĩÄĪûģ¯ĪĩŊy°Š°YŖŦ˛ģH°l˛Ąë[ąÎļøĮŌîAēķO˛îŖŦîAĶĩŊ2030ÄęËüĸŗÉéÃĀøĩÚļū¸ßÖÂËĀÂĘĩÄ°ŠˇNĄŖÄŋĮ°ÉĐoŗÉĘėĶĐЧĩÄÖίˇŊ°¸ŖŦátWŊįAĪōĶÚ˛ĄČËĪČŊĶĘÜĐgĮ°ÖίÔŲßMĐĐĘÖĐgĮĐŗũí¸ÄÉÆîAēķĄŖČģļøŌČĪŲ§šÜ°ŠĻˇÅģ¯¯ĩÄŋšĐÔŌÔŧ°ĐgĮ°ÖίĻĘŖĶāÄ[Áöŧ°ûŋÉÄÜÔėŗÉĩÄĶ°íŌĀČģĘĮÖiFĄŖÔÚˇÖ×ĶˇÖĐ͡ŊÃæŖŦŌČĪŲ§šÜ°ŠĩÄĪāęPŅĐžŋŌ˛ŌĀČģĖĶÚŗõŧëAļÎĄŖÄŋĮ°Í¨ß^´ķKŊMŋRNAˇÖÎöĘÖļÎŖŦÖģĶĐÉĐÍŖēclassicĐÍēÍbasalĐÍĄŖļøß@ÉĐÍŌ˛ÉĐëyĻÄŋĮ°ĩÄÔ\¯ˇŊ°¸×öŗöĶĐЧĩÄÖ¸§×÷ĶÃĄŖŌō´ËŖŦͨß^ĻŌČĪŲ§šÜ°ŠŊMŋÎĸhžŗÖĐĩÄ°Šŧ°ûŖŦÃâŌßŧ°ûēÍÄ[ÁöĪāęPŗÉĀwžSŧ°ûßMĐĐÔŧžĢĘĩġÖ×ĶˇÖĐÍēÍÉúÎīËĶÎīˇÖÎöŖŦĸŗÉé¸ÄÉÆ˛ĄČËÔ\ÖÎēÍîAēķĩÄÍģÆÆŋÚĄŖ
ŊüČÕŖŦÂéĘĄĀ횤WÔēĩÄAviv RegevFę Ę×´Îͨß^Îŧ°ûēËRNAyĐōŌÔŧ°ŋÕégČĢŪDäŊMWŧŧĐgĩÄÂēĪĒĶÃŖŦĻŊĶĘÜÁËĐgĮ°ÖίēÍδŊĶĘÜĐgĮ°ÖίĩÄŌČĪŲ§šÜ°ŠĶąžßMĐĐÁËŧ°ûČēÂäŖŦˇÖ×ĶÉúÎīËĶÎīēÍŋÕégĐÅĪĸĩÄÉîļČŊâÎöĄŖÔÚŌČĪŲ§šÜ°ŠˇÖ×ĶˇÖĐÍÉîļČŅĐžŋˇŊÃæŖŦŌÔŧ°ĶÉĐgĮ°ÖίēÍÃâŌßÎĸhžŗĻ°Šŧ°ûÔėŗÉĩÄĶ°íˇÖÎöˇŊÃæĢ@ĩÃÁËÍģÆÆĐÔ°lŦFĄŖ
Ę×ĪČŖŦŅĐžŋFę ˛ÉĶÃÎŧ°ûēËyĐōĩġŊˇ¨é_Õšŧ°ûˇÖĐÍš¤×÷ĄŖÔˇŊˇ¨ŋÉąÜÃâŌČĪŲ§šÜ°ŠŅĐžŋĩÄÆäÖĐŌģŧŦĘÖëyî}ŖŦŧ´ĶÉĶÚĀwžSģ¯ēÍŊMŋŊĩŊâ§íĩÄŧ°ûpûĻģųŌōąíß_ˇÖÎöĩÄĶ°íĄŖ ČģļøÎŧĩÄÎŧ°ûēËyĐō˛ĸ˛ģÄÜ°ŅÄŗŌģĖØļ¨°Šŧ°ûÅcÆäÖÜú¸ģŧ¯ĩÄÃâŌßŧ°ûģōÕßŗÉĀwžSŧ°ûßMĐĐęPÂĄŖŌō´ËŖŦŅĐžŋFę ÍģÆÆĐÔĩØ˛ÉĶÃNanoStringĩÄGeoMx DSPŋÕégČĢŪDäŊMēÍŋÕég°ĐĪōŪDäŊMŧŧĐgŖŦÔÚĪāÍŦĩÄŌČĪŲ§šÜ°ŠĶąžÖĐĻŊMŋÖвģÍŦĩÄŧ°ûČēÂäßMĐĐÁËŋÕégˇÖÎöŖŦÔŲͨß^ˇ´žíˇeŖ¨DeconvolutionŖŠĩÄÄŖĐÍÅcÎŧ°ûēËRNAyĐōĩÄĩūŊYēĪĻĶŗˇÖÎöŖŦĶĐЧˇÖąæŗö˛ģÍŦ°Šŧ°ûŧ°ÆäĪāęPĩÄÃâŌßŧ°ûŖŦÄļøŦFÔÚŋÕégĐÅĪĸēÍÎŧ°ûžĢļČĶÃæĩÄ×îģ¯ĄŖß@ĻĐÂĩÄÔ\¯ˇŊ°¸é_°lū¸üĶĐÖ¸§rÖĩĄŖ
A. Experimental workflow for digital spatial profiling on the GeoMx platform (NanoString)
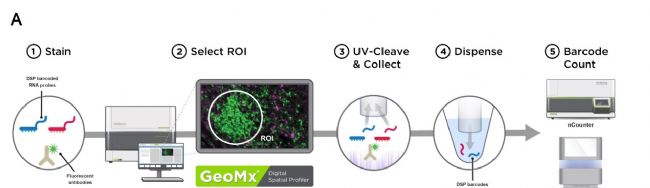
B. Spatial resolution of cell types across ROIs and AOIs. Expression (z-score of normalized counts across AOIs; purple/yellow color bar) of signature genes (rows) from diverse cell types (color legend (4) and left bar) across AOIs (columns, color legend and horizontal bar (3)) profiled by 1,412-gene cancer transcriptome atlas or CTA, capturing epithelial (green), fibroblasts (blue) and immune (red) cells, from ROIs characterized by presence or absence of immune (color legend and horizontal bar (1)) and fibroblast (color legend and horizontal bar (2)) infiltration. Both columns and rows are clustered by unsupervised hierarchical clustering
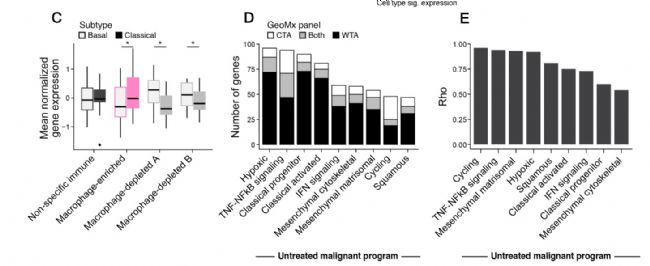
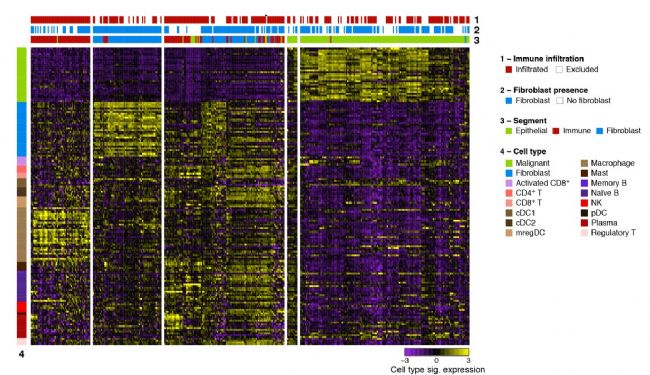
C. Box-plots comparing mean normalized gene expression by cluster for basal-like vs. classical-like epithelial AOIs. * p < 0.05, Student’s t-test.
DŖŽCoverage of PDAC snRNA-seq programs by CTA and WTA digital spatial profiling. Number of genes (y axis) from each untreated malignant cell program (x axis) captured by CTA only (white), WTA only (black), or both (grey)
E. Impact of gene panel on program scores. Spearman correlation coefficient () between the scores for different untreated malignant programs (x axis) obtained with WTA using the full gene panel vs. the gene subset shared with the CTA assay
ŊüÄęŖŦëSÖøŋÕégÉúÎīWr´úĩÄĩŊíŖŦŋÕégŪDäŊMŧŧĐgÔÚÄ[ÁöÃâŌߥĸÄ[ÁöÎĸhžŗĩÄÉîļȡÖÎöĒĶÃČÕĐÂÔÂŽĄŖNanostring GeoMx DSP×÷éÄŋĮ°Ä[ÁöÃâŌߥĸÎĸhžŗŅĐžŋîIĶōĩÄĐÂĐÔŊâQˇŊ°¸ēÍš¤žßŖŦŌŅąģøČÍâļāFę ĶÃĶÚÄ[ÁöŖŦÉņŊŋÆWŌÔŧ°ĐšڲĄļžŅĐžŋĄŖ
éĘšÔĮ°ŅØĐÂŧŧĐg˛ģāÖúÁĻÄ[ÁöÃâŌßĩČĪāęPŅĐžŋŖŦNanostringĸÅcĀäČĒ¸ÛÉúÎīŋÆŧŧšÉĶĐĪŪšĢËžĶÚ2020Äę10ÔÂ15ĖĪÂÎįš˛ÍŦÅeŪk“ŋÕégļāŊMWŧ°°Š°YŅĐžŋŧŧĐgŅĐĶūôßĩÚËÄÃNanostring´ķÖĐČA
^ĶÃôū”ŖŦÃrĸŅûÕÖĐø´ķęēÍÅ_ŗĩØ
^ĩÄÖĒÃûÄ[ÁöŅĐžŋĩÄŖŧŌßMĐĐŧŧĐgŅĐĶĄŖ
ū×hŊMÕ\ŅûøČŖŧŌēÍŋÍôÛxÜSĶ^ŋ´ŖŦˇeO
ĸÅcū×hWĐgŊģÁ÷ĄŖßÃčļūžS´aŖŦŗÉšĻ×ĸÔ
ĸūČËTŖŦĶĐCūÚAČĄŦFŊđŧt°üĄŖ

ÂĪĩëÔŖē021-58952661ŖŦ58953141
E-mailŖēyinbenliang@cs-biotech.com


- ÔÚžÖv×ųŖēBSIČĢĐÂŲ|×VÜŧūŽaÆˇProteoformX ŊéŊB
- ÃâŲMÖv×ųŖē|ˇÄ¤ÆŦãQŧŧĐgĪĩÁĐÖv×ųĩÚÆßÆÚ
- 2025îIēŊÕߡåūŅûÄúŌģÍŦÍąPÖĐøĐÂËēÎŌÔŌũąŦČĢĮō
- Öv×ųŖēĀûĶÃCellmaticĪĩŊyŦFhiPSC×ÔĶģ¯UÔö
- ĖÕĐgÉúÎīŧŧĐgÖv×ųîA¸æŖēČËš¤ÖĮÄÜËÎīÔOĶĩÄĶÃˇŊˇ¨
- īwŧ{Öą˛ĨŖēŋÉŦFĩØDĘŊ×VDŧĶ˛ĘÉĢŗÉĪņĩÄßÃčëįR
- ÄX-ķwģĨ×÷ŅĐžŋĮ°ŅØŧŧĐgÅāĶūÔÚéLÉŗŗÉšĻÅeŪk
- ßMŋÆņY°˛ĩÚžÅöBMGļāšĻÄÜøËxžÉĪ´đŌÉūŅûÕē¯
- CNSDĄ¤CNSËÎīé_°lÅcĐÂŧŧĐg°lÕš´ķūģîĶ×hŗĖ
- ū×hͨÖĒŖē2025Äę¸ßšâ×VyÁŋŧŧĐgŧ°ĒĶÃWĐgŊģÁ÷ū
- ÔÚžÖv×ųŖēBSIČĢĐÂ°æąžĩ°°×Ų|ŊMW¸ßŧˇÖÎöÜŧūŊéŊB
- MCEÖą˛ĨîA¸æŖēĶÎīŊoËÖŽžÖ˛ŋŊoˡŊĘŊŧ°×ĸŌâĘÂí
- Öv×ųŅûÕŖēžĢĘátWÉúÎīĐÅĪĸWĮ°ŅØŅĐĶÅc¸ßŧÅāĶ°ā
- ČđÎÖĩÂĪĩÁĐÖą˛ĨÖŽČįēÎĢ@ČĄ¸ßŲ|ÁŋĩÄÎŧ°ûŌŌē
- ÃâŲMÖv×ųŅûÕŖē|ˇÄ¤ÆŦãQŧŧĐgĪĩÁĐÖv×ųĩÚÁųÆÚ
- ŌōÃĀŧ{ŅûÄú ĸŧĶCSCOĩÚžÅÃŅĒŌēÄ[ÁöWĐg´ķū
- NGDx2025ÖĐøĪČßMÔ\āŧŧĐgé_°lÅcĒĶÃÕ¯×hŗĖąí
- 10x Chromium GEM-XĶÎīŧ°ĐķÄÁîŅĐžŋĒîĶĸĶ
- VizgenyÉÎ÷ŲÖĮÁÁĪāŋÕégÉúÎīøëHū×hˇÖĪíŋÕŪDßMÕš
- âųÃĀͨĩÂÕũĘŊŗÉéPacBioÖĐø ^ĘÚā´úĀíÉĖ
- ĪāŧsBioCon2025ŖŦŌōÃĀŧ{ŅûÄúš˛ÔÄ[ÁöžĢĘátWĐÂÆĒÕÂ
- âųÃĀͨĩÂŅûÄúš˛¸°Îŧ°ûŧ°ŋÕégŪDäĩ°°×ļāŊMWÕ¯
- 10x GenomicsŧŧĐgˇŊ°¸¸üĐÂ(5ÔÂ)ŖŦĐÂĘÖÔŅûÄúĪÂŨd
- 10xĐÂÆˇ°l˛ŧžWŊjŅĐĶū:Visium HD 3Ą¯ŋÕégˇÖÎöˇŊ°¸
- Oxford NanoporeÃ÷ČÕÖą˛ĨŖēŧ{Ã×ŋ×yĐō´ķūĖĢŖö
- 10xŅûÄúķÃûVisiumēÍXeniumĩūˇÖÎöŅĐĶū(ąąžŠö)
- ĩÚČũÃÖĐøøëHÉúÖŗátWŊĄŋĩ´ķūŖ¨ąąžŠÕžŖŠÍ¨ÖĒ
- 10x GenomicsŧŧĐgˇŊ°¸¸üĐÂ(4ÔÂ)ŖŦĐÂĘÖÔŅûÄúîIČĄ
- 10xŅûÄú ĸŧĶÎŧ°ûÅcŋÕégļāŊMWĮ°ŅØˇåū-ąąžŠÕž
- Õæß~FASTASeq 300 DxĢ@ÅúNMPAČũîát¯Æ÷Đĩ×ĸÔ×C